

One screen for every site you funded
The Get Zero plantation monitoring dashboard shows a health map, a survival curve and a list of what needs attention today, for every site you have.
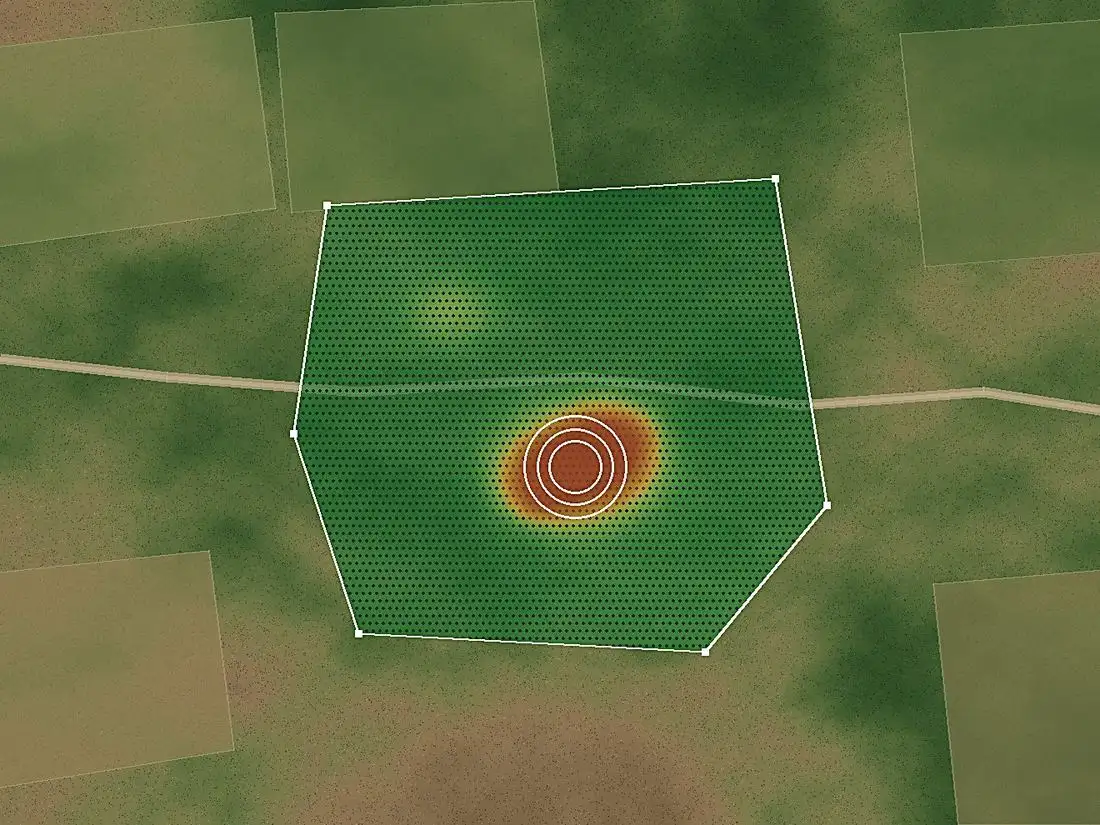
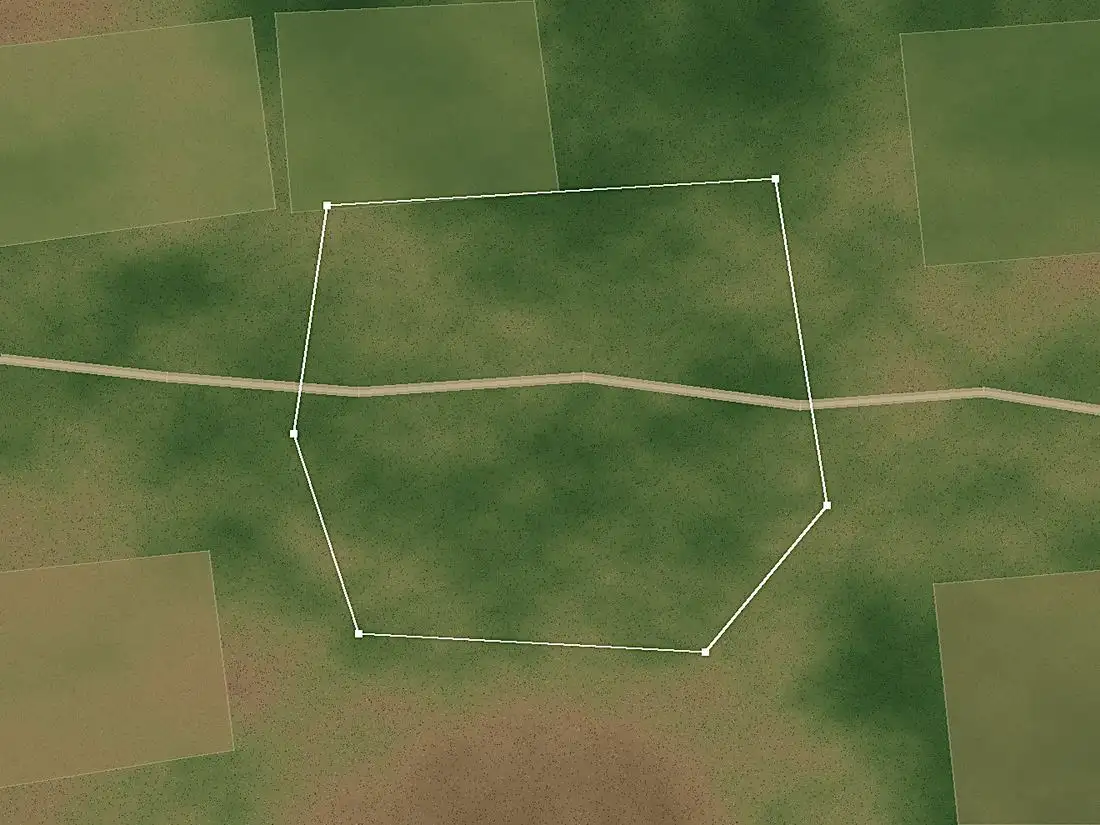
Green is doing well, red is dying. Each shade covers about 10 metres of ground.
Survival since planting
What needs attention
What you get with Get Zero
Health map
Your site as a grid of 10 metre squares, each scored for plant health. A failing patch shows up as a shape, not a line in a report.
Survival curve
Month by month since planting, for every site and every project. This is the chart that goes in your annual report.
Alerts
Water stress, slowing growth and canopy loss, named by block, in plain words, sent while you can still do something.
Survival reports
A dated survival rate per site and per project, ready for boards, auditors, CSR impact assessments and funders.
Impact certificates
Share verified results with partners, volunteers and donors, backed by the same satellite record.
Drone surveys
On Plan 02, drones fly up to 7 locations twice a month for tree level detail where it matters most.
How to start, in three steps
Send us your site boundaries
A KML file, a shapefile or a list of GPS points for each plantation. Nothing to install on the ground.
We read every site every few days
Satellite imagery is scored square by square and compared with earlier readings, through the monsoon too.
You see what is alive, and what needs help
The dashboard, alerts and reports update on their own. You act on the blocks that are failing.
Want the detail behind the scores? Read how satellite tree monitoring works, or see pricing.